To support my goal of as much financial transparency as possible on this blog, I’ve created this page to give a detailed overview of my financial situation and historical data.
My Net Worth
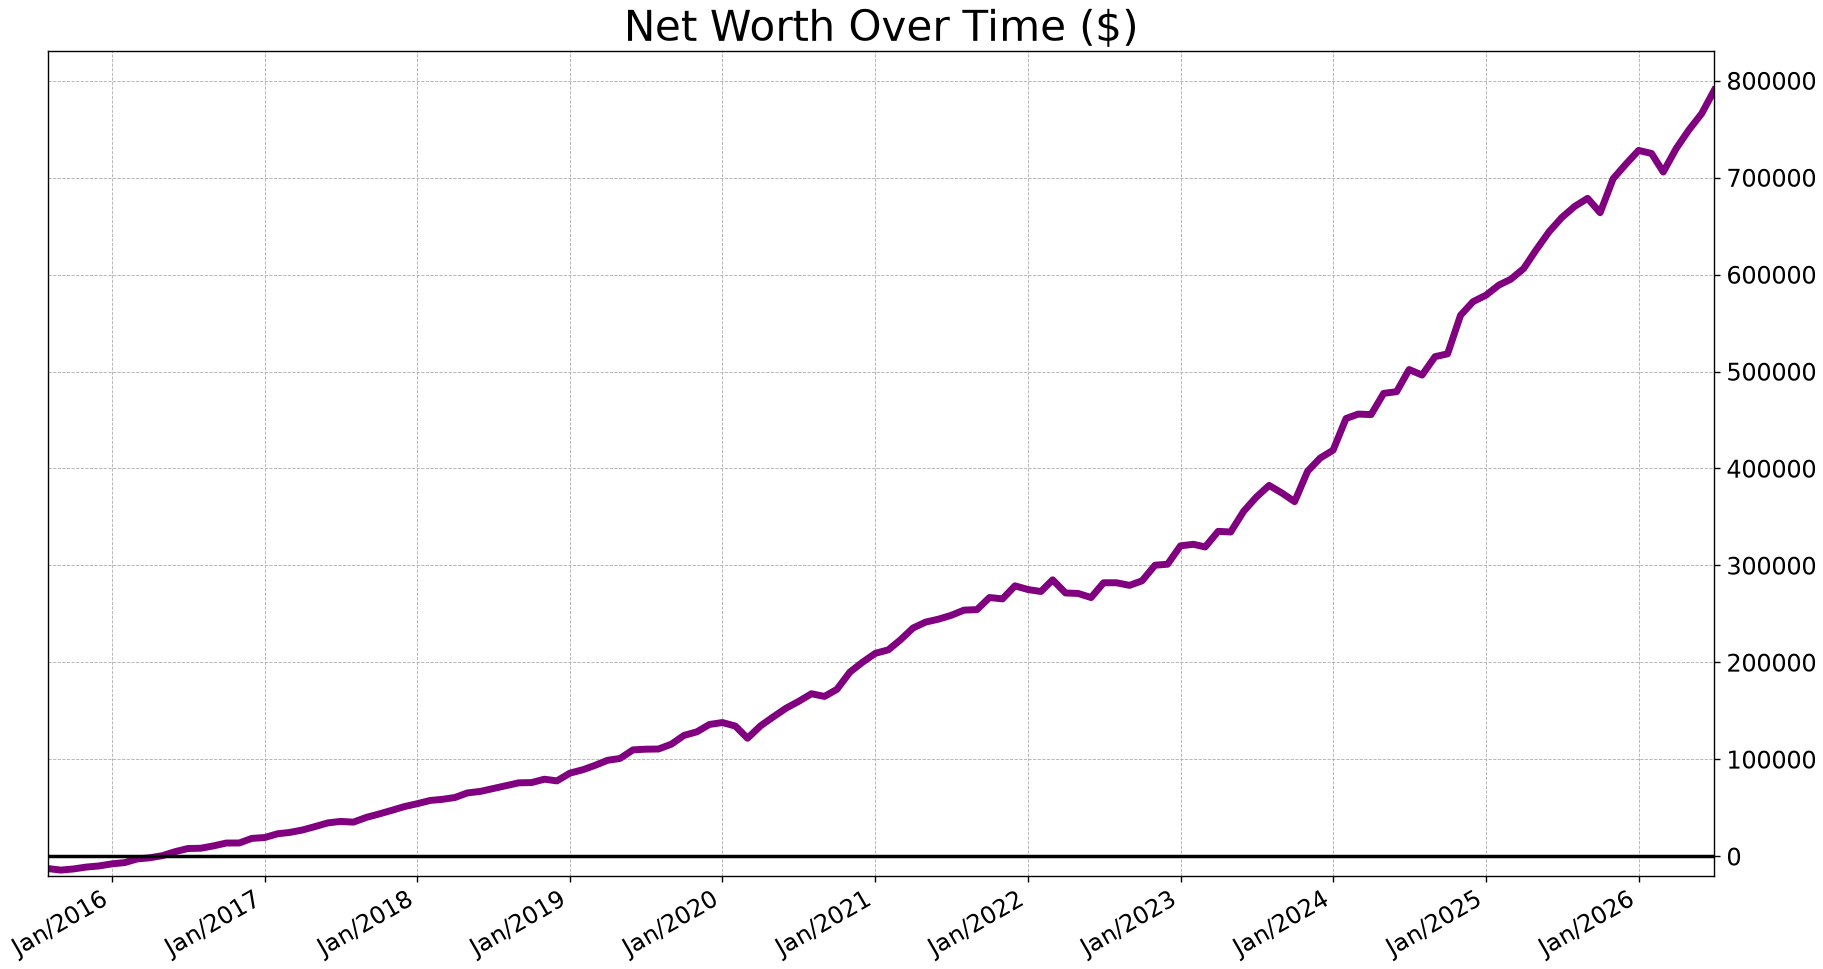
Here’s a graph of my net worth, starting after college graduation. Data points are taken the last day of each month. Newest data point is the last day of July 2026, where my net worth was $790,100!
My Asset Allocation
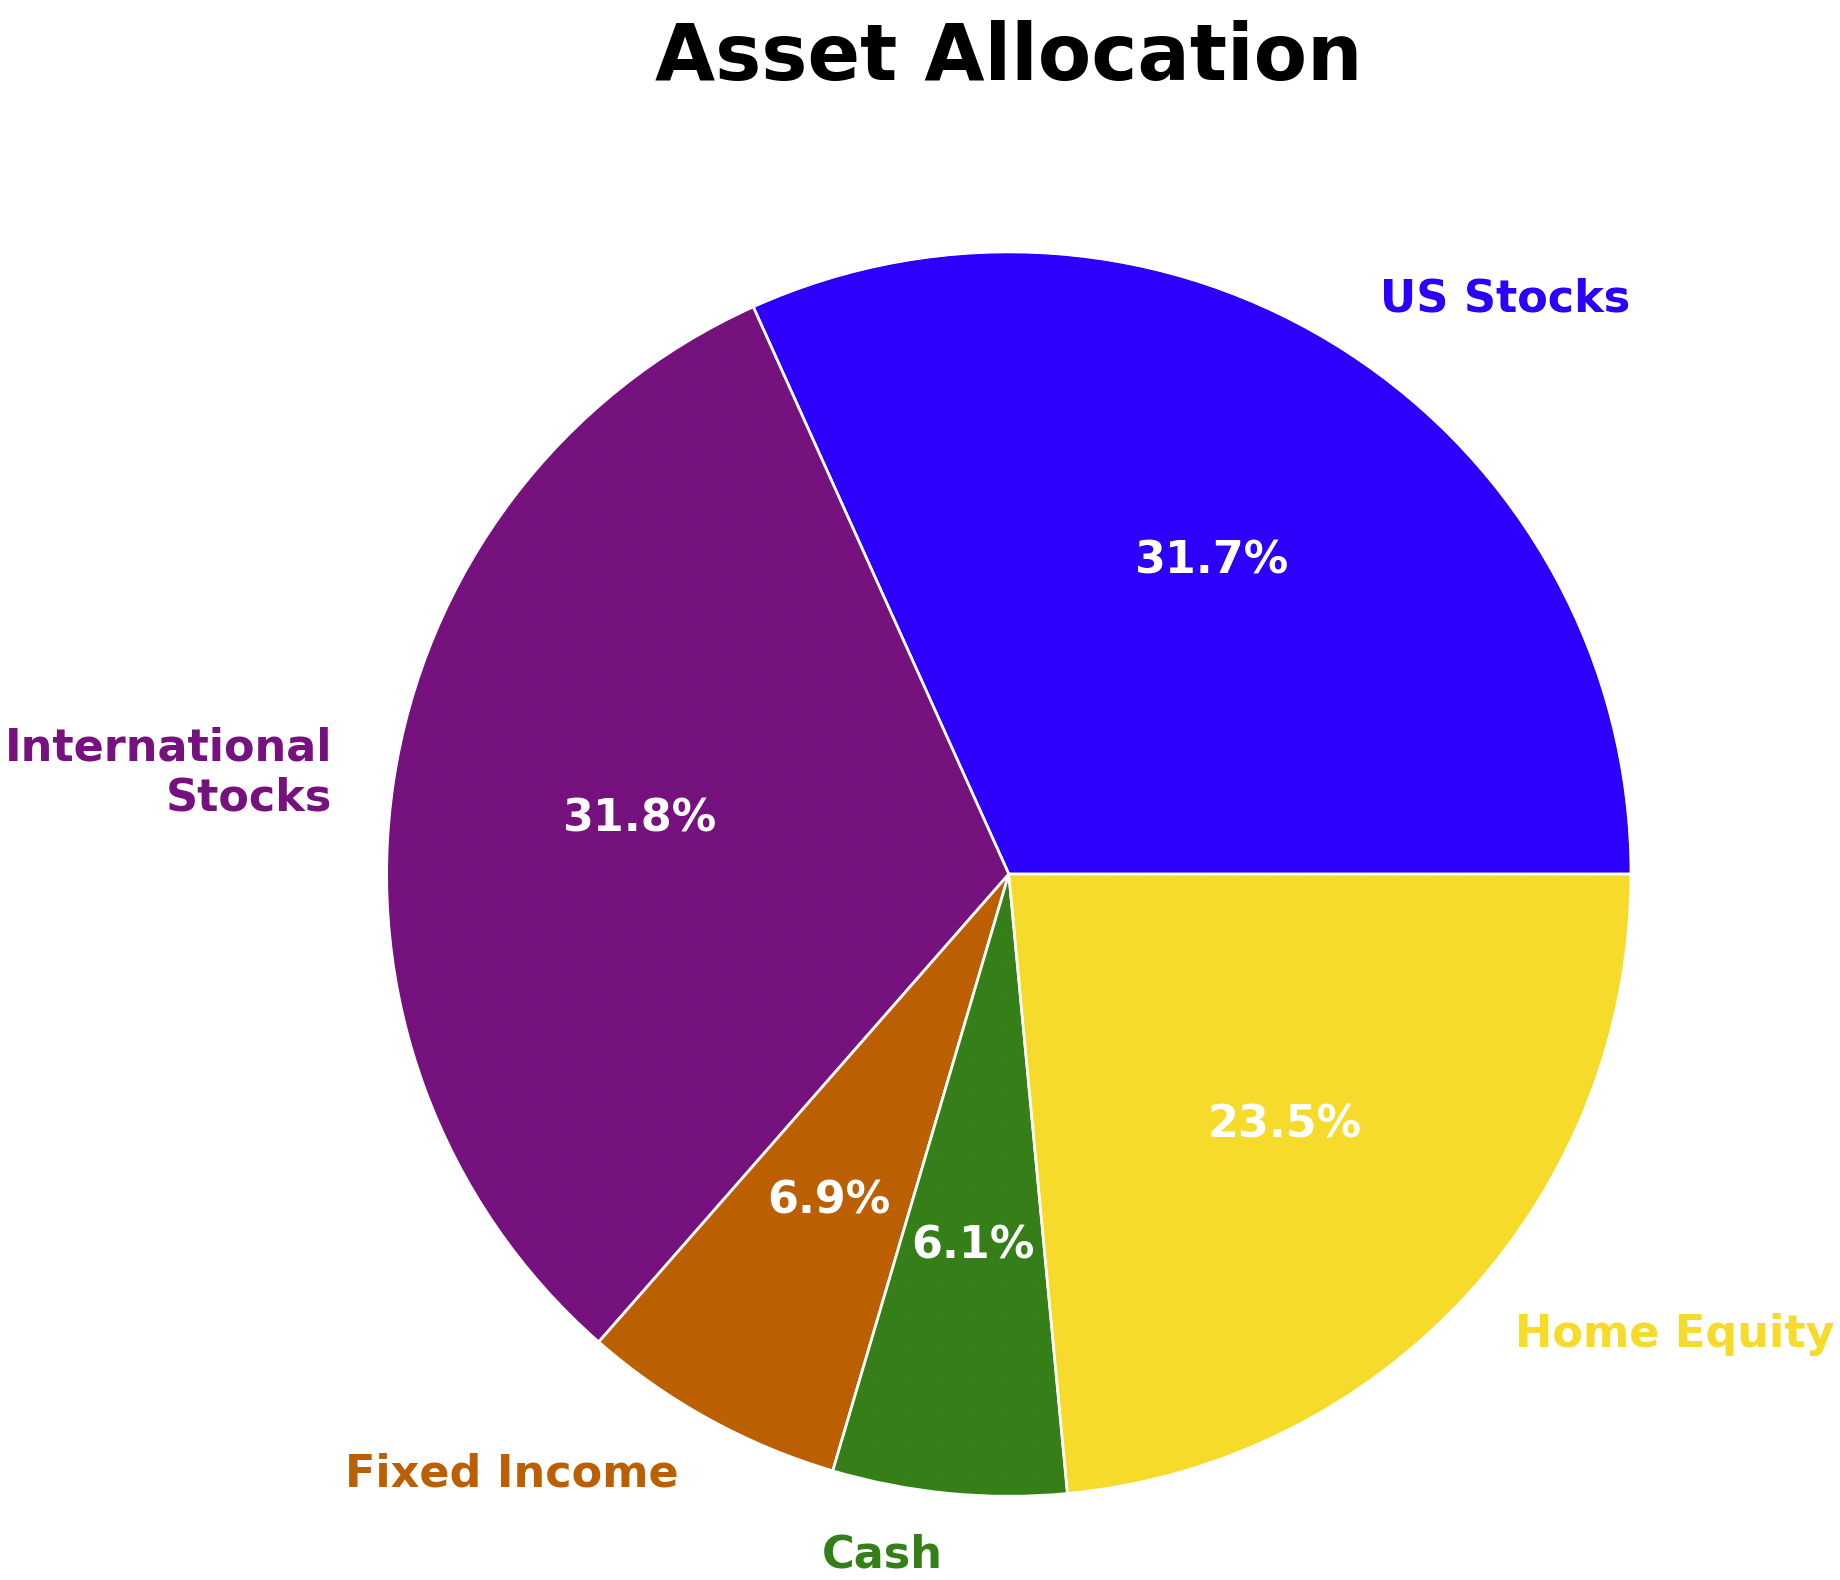
This is the distribution of all of my assets, last updated in September 2025. I’ll refresh this once or twice per year.
My Income History
And here’s my historical annual gross income, updated when I file taxes for the prior year:
| Year | Gross Income |
|---|---|
| 2015 | $25,800 |
| 2016 | $62,700 |
| 2017 | $71,500 |
| 2018 | $80,200 |
| 2019 | $90,700 |
| 2020 | $91,100 |
| 2021 | $99,600 |
| 2022 | $109,200 |
| 2023 | $117,100 |
| 2024 | $124,400 |
| 2025 | $133,900 |
My Spending
Twice annually (every January and July) I do a full spending and budget review of the prior six months. I meticulously track every expense to provide a highly accurate categorized breakdown of my average monthly spending. Through these posts I hope to demonstrate that living well by spending much less than the average American is possible. You can find my most recent budget review post here.